How to run a traceroute
A traceroute checks how data packets are sent to a specific address using your internet connection, taking note of each stop along the way. It's a good way to see the latency (delay) between different servers that make up the internet.
If you use PingPlotter, it will run a traceroute and a ping test at the same time.
Select one of the links below to jump to a query:
- PingPlotter on Windows
- PingPlotter on macOS
- PingPlotter on iOS (iPhone/iPad)
- Traceroute in Windows
- Traceroute in macOS
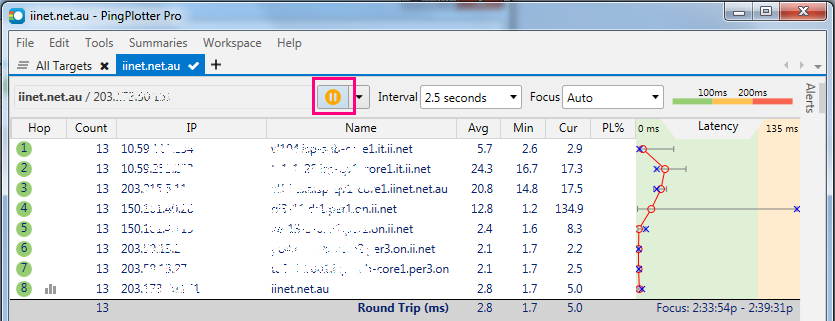
PingPlotter on Windows
- Visit http://pingplotter.com/download to download and install the PingPlotter application.
You don't need to buy a subscription, you can use the Free version. - Open PingPlotter and hit the + (plus) icon to open a New Trace tab.
- Type iinet.net.au or another address you want to to ping or traceroute, then hit Start.
- Let the test run for at least 60 seconds, then hit Pause.
- Hit the Print Screen (PrntScr) key on your keyboard to screenshot your test results. You can use CTRL+V to paste your screenshot into any text editor, image editor or email app.
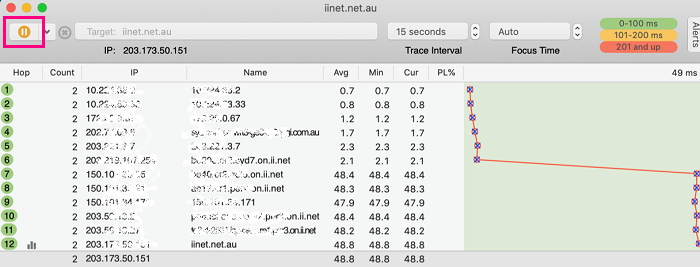
PingPlotter on macOS
- Download PingPlotter at: http://pingplotter.com/download
You don't need to buy a subscription, you can use the Free version. - Open PingPlotter and type iinet.net.au or another address you want to ping or traceroute, then hit the Start.
- Let the test run for at least 60 seconds, then hit Pause.
- Use the Command ⌘+Shift+3 keys on your keyboard to screenshot your test results. You can use Command ⌘+V to paste your screenshot into any text editor, image editor or email app.
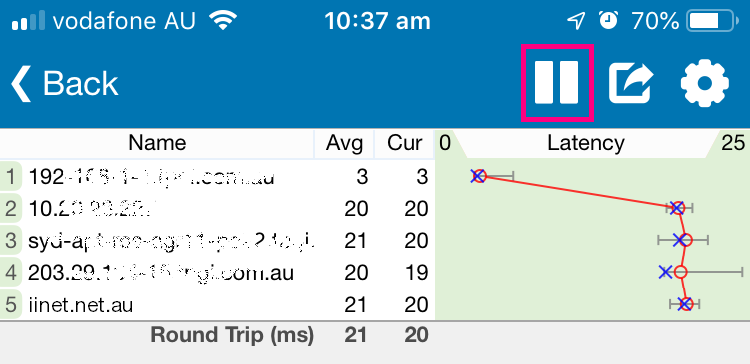
PingPlotter on iOS (iPhone/iPad)
- Open the App Store and search for 'PingPlotter" to install PingPlotter.
You don't need to buy a subscription, you can use the Free version. - Open PingPlotter and type iinet.net.au or another address you want to ping or traceroute, then hit Start.
- Let the test run for at least 60 seconds, then hit Pause.
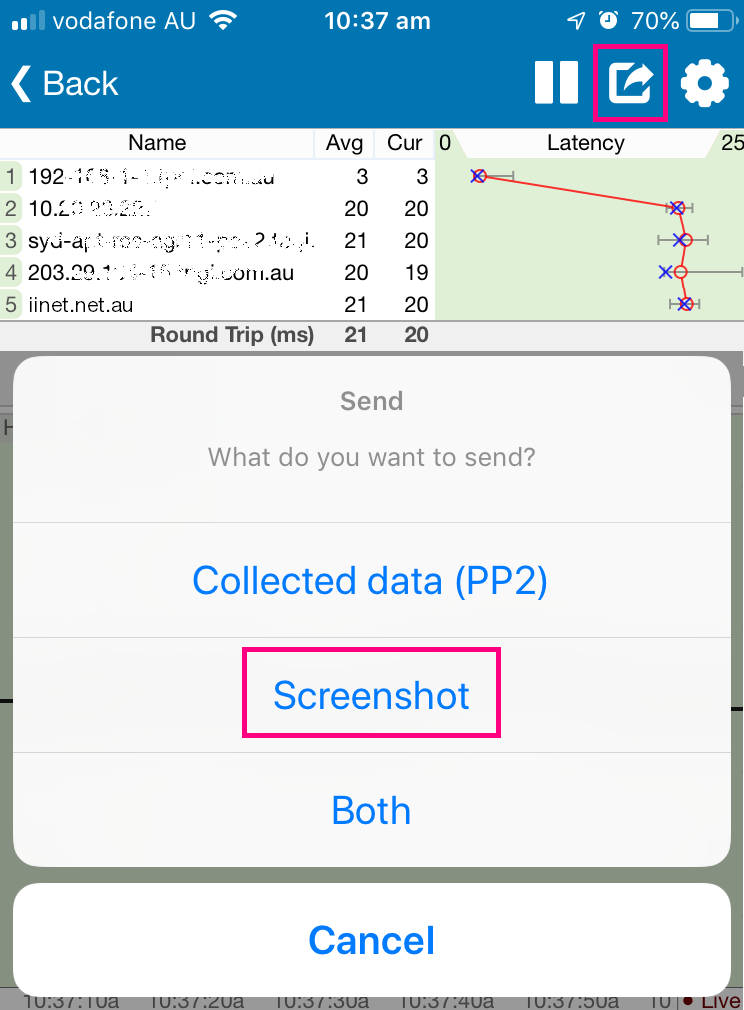
- Hit the Share icon and select Screenshot.
- You can choose to save your screenshot to Pictures, or share it by Mail.
Traceroute in Windows
- Hit Search and type "cmd" into the search bar.
- Open the Command Prompt app.
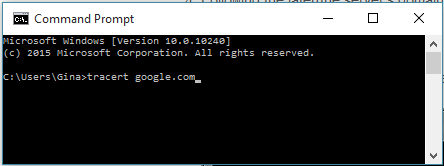
- Type the address you want to traceroute, e.g. "tracert google.com" then hit Enter on your keyboard.
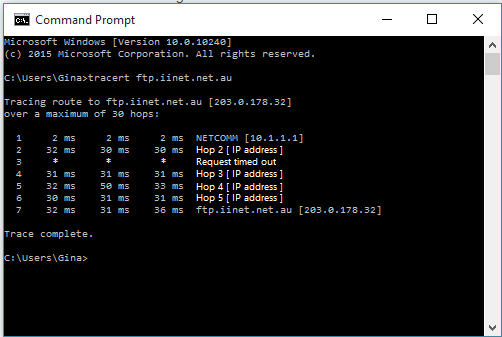
- Wait for the test to finish. A traceroute will test a maximum of 30 "hops". Each hop is a new server that the data passes through on its way to its destination. The first hop is your modem, and the last hop is the server for the address you've tracerouted.
Don't worry if some hops come up as "* * * Request timed out". Some servers deliberately ignore the data packets used for traceroute tests. - Three latency times (in milliseconds) will be shown before the domain or IP address for each hop. The mean average of these times is considered to be the latency for that server, e.g:
"Tracing route to ftp.iinet.net.au [203.0.178.32] over a maximum of 30 hops:
1 2ms 2ms 2ms NETCOMM [10.1.1.1]
2 32ms 30ms 30ms Hop 2 [IP address]"
In this example, 32ms + 30ms + 30ms / 3 = a latency of 30.66 milliseconds for the server on Hop 2.
You can search online for a specific IP address to get a better idea of where it is. - To copy-paste your traceroute results: Right-click in the Command Prompt window and select Mark to turn on the cursor. You can use the up/down arrow keys on your keyboard to move the cursor to the start of the text you want to copy.
Hold the Shift key and use the down/right arrow keys to highlight the text you want to copy, then hit the Enter key to copy the text.
Open Word, Notepad or any other text editor or email app and use CTRL+V to paste the copied text.
Traceroute in macOS
- Open Finder and select Applications > Utilities, then open the Terminal app.
- Type “traceroute” and then hit Space on your keyboard.
- Type the address you want to traceroute, e.g. "tracert iinet.net.au", then hit Enter on your keyboard.
- Wait for the test to finish. A traceroute will test a maximum of 30 "hops". Each hop is a new server that the data passes through on its way to its destination. The first hop is your modem, and the last hop is the server for the address you've tracerouted.
Don't worry if some hops come up as "* * * Request timed out". Some servers deliberately ignore the data packets used for traceroute tests. - Three latency times (in milliseconds) will be shown before the domain or IP address for each hop. The mean average of these times is considered to be the latency for that server, e.g:
"Tracing route to ftp.iinet.net.au [203.0.178.32] over a maximum of 30 hops:
1 2ms 2ms 2ms NETCOMM [10.1.1.1]
2 32ms 30ms 30ms Hop 2 [IP address]"
In this example, 32ms + 30ms + 30ms / 3 = a latency of 30.66 milliseconds for the server on Hop 2.
You can search online for a specific IP address to get a better idea of where it is. - To copy-paste your traceroute results: Click and drag the cursor to select the text you want to copy, then right-click and select Copy, or hit Command ⌘+C on your keyboard.
Open TextEdit or any other text editor or email app and use Command ⌘+V to paste the copied text.


