Checking your data usage in Toolbox
You can check the data usage for your iiNet internet service at any time. If you have a monthly data plan instead of an unlimited data plan, we'll also let you know when you've hit 50%, 85% and 100% of your monthly data.
Data usage isn't available if you have a Liimitless data plan.
Select one of the links below to jump to a query:
Basic usage for the current billing period
- Log in to Toolbox and view the Dashboard.
- Check the Volume usage meter in the panel for the service. This will also tell you whether the data is Peak/Off-Peak or Anytime.
- The text below the usage meter will also advise you when your usage resets, e.g. "Your usage resets in 5 days".
- If you’re not seeing a panel for one of your services, make sure it is turned ON after clicking Customise Dashboard Panels at the bottom of the page.
How to view detailed usage and peak/off-peak quota times
Toolbox also allows you to view your broadband usage in more detail, including:
- Peak and off-peak downloads, or anytime downloads (depending on your plan)
- Uploads
- Hourly/daily usage
- Freezone usage (eligible plans)
- Log in to Toolbox and select My Products*, then select the tab for your service type;
- For mobile data that's part of a mobile voice plan, select Mobile.
- For all other internet services, select Broadband.
*If you're on a mobile device and you don't see this option, click the grey square with three lines to show the navigation menu. - If you have more than one internet or mobile service, make sure the right username or mobile number is selected from the Product drop-down menu.
- Select View volume/data usage from the Actions menu. If you're on a mobile device and you don't see the Actions menu, click the grey bar labelled Broadband actions to show it.
- If you want to check usage from a previous month, you’ll need to select the month from the See usage from drop-down menu.
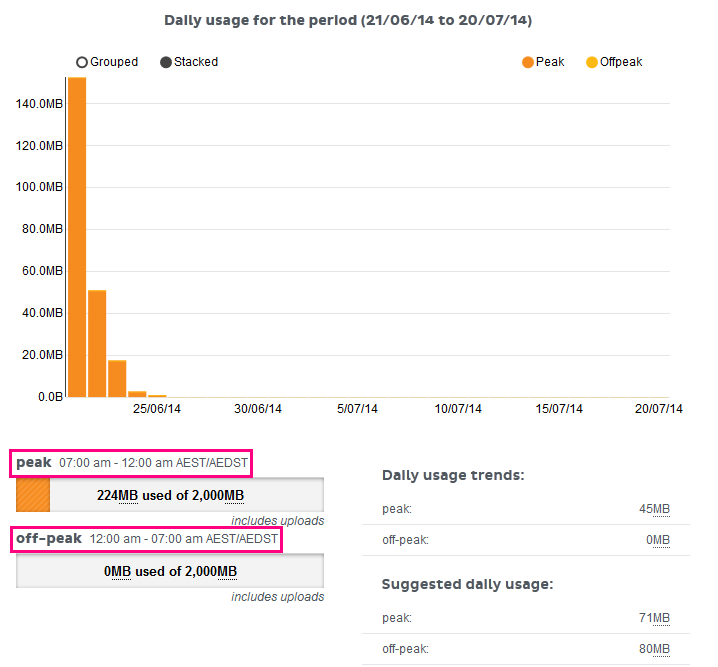
- If you're on a desktop or laptop, you’ll see your volume usage for the selected billing period as a daily graph (example below). Please note that no graph will be displayed on mobile devices.
If your plan has Peak/Offpeak usage, you'll find the timeframes for each period above the peak and off-peak usage bars located below the graph as shown below.
Tip: "Stacked" view shows by default, but you can select the “Grouped” option above the graph for a clearer distinction between Peak/Offpeak usage or Anytime/Freezone usage (depending on your plan).
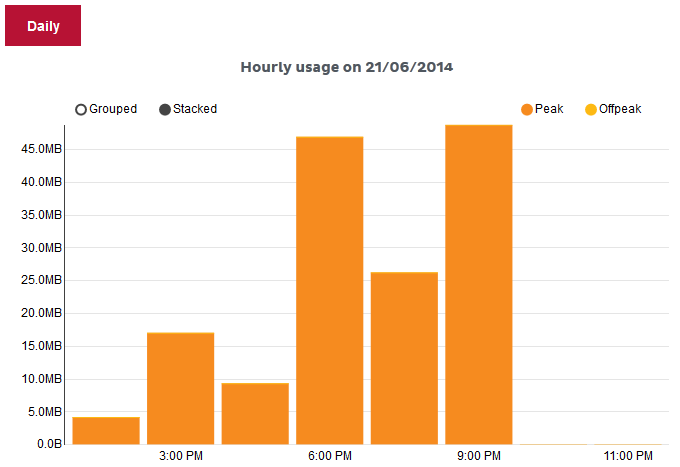
- If you scroll further down the page, you’ll also find list of your daily usage. Click on the date to see hourly usage.
- Much like daily usage, hourly usage will be shown as a graph (desktops/laptops only - mobile devices will display a table instead) with a list further down the page. You can use the Daily button to return to daily view.
Note: Provided that the time zone in Toolbox > My Account > Set my timezone is set to "Automatically detect my time zone", all times given for hourly usage are in local time depending on your current location.


